Simple function to create a histogram
histogram(
  vector,
  bins = NULL,
  theme = ggplot2::theme_bw(),
  xLabel = NULL,
  yLabel = "Count"
)
Arguments
- vector
A variable or vector.
- bins
The number of bins; when 0, either the number of unique values in
vectoror20, whichever is lower.- theme
The ggplot2 theme to use.
- xLabel, yLabel
Labels for x and y axes; variable name is used for x axis if no label is specified.
Value
A ggplot2 plot.
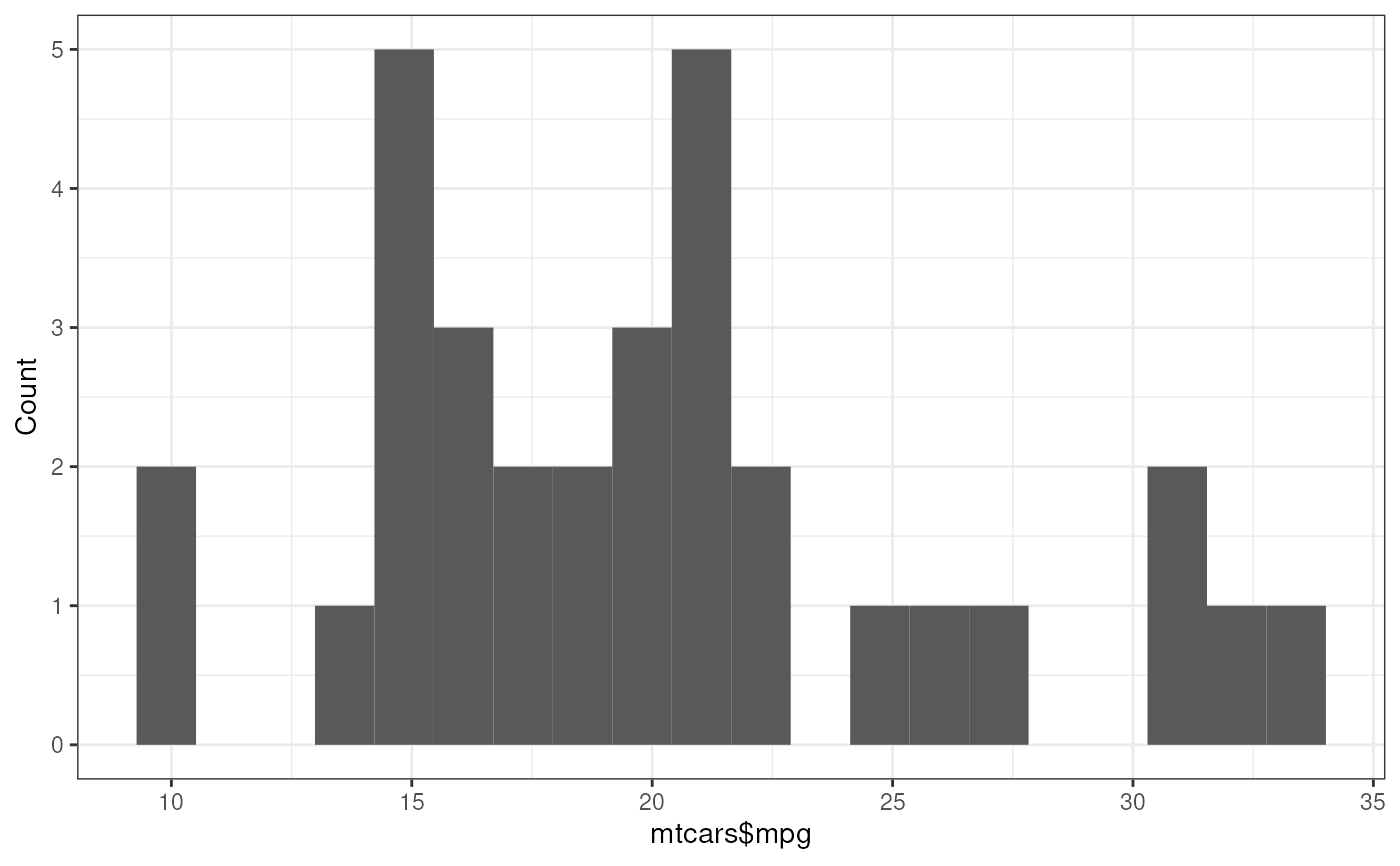
Examples
rosetta::histogram(mtcars$mpg);