This function is intended to provide a very easy interface to generating
pretty (and pretty versatile) ggplot2::ggplot() scatter plots.
scatterPlot(
  x,
  y,
  pointsize = 3,
  theme = theme_bw(),
  regrLine = FALSE,
  regrCI = FALSE,
  regrLineCol = "blue",
  regrCIcol = regrLineCol,
  regrCIalpha = 0.25,
  width = 0,
  height = 0,
  position = "identity",
  xVarName = NULL,
  yVarName = NULL,
  ...
)
Arguments
- x
The variable to plot on the X axis.
- y
The variable to plot on the Y axis.
- pointsize
The size of the points in the scatterplot.
- theme
The theme to use.
- regrLine
Whether to show the regression line.
- regrCI
Whether to display the confidence interval around the regression line.
- regrLineCol
The color of the regression line.
- regrCIcol
The color of the confidence interval around the regression line.
- regrCIalpha
The alpha value (transparency) of the confidence interval around the regression line.
- width
If
positionis'jitter', the points are 'jittered': some random noise is added to change their location slightly. In that case 'width' can be set to determine how much the location should be allowed to vary on the X axis.- height
If
positionis'jitter', the points are 'jittered': some random noise is added to change their location slightly. In that case 'height' can be set to determine how much the location should be allowed to vary on the Y axis.- position
Whether to 'jitter' the points (adding some random noise to change their location slightly, used to prevent overplotting). Set to
'jitter'to jitter the points.- xVarName, yVarName
Can be used to manually specify the names of the variables on the x and y axes.
- ...
And additional arguments are passed to
ggplot2::geom_point()orggplot2::geom_jitter()(ifjitteris set to'jitter').
Value
A ggplot2::ggplot() plot is returned.
Details
Note that if position is set to 'jitter', unless width and/or
height is set to a non-zero value, there will still not be any
jittering.
Examples
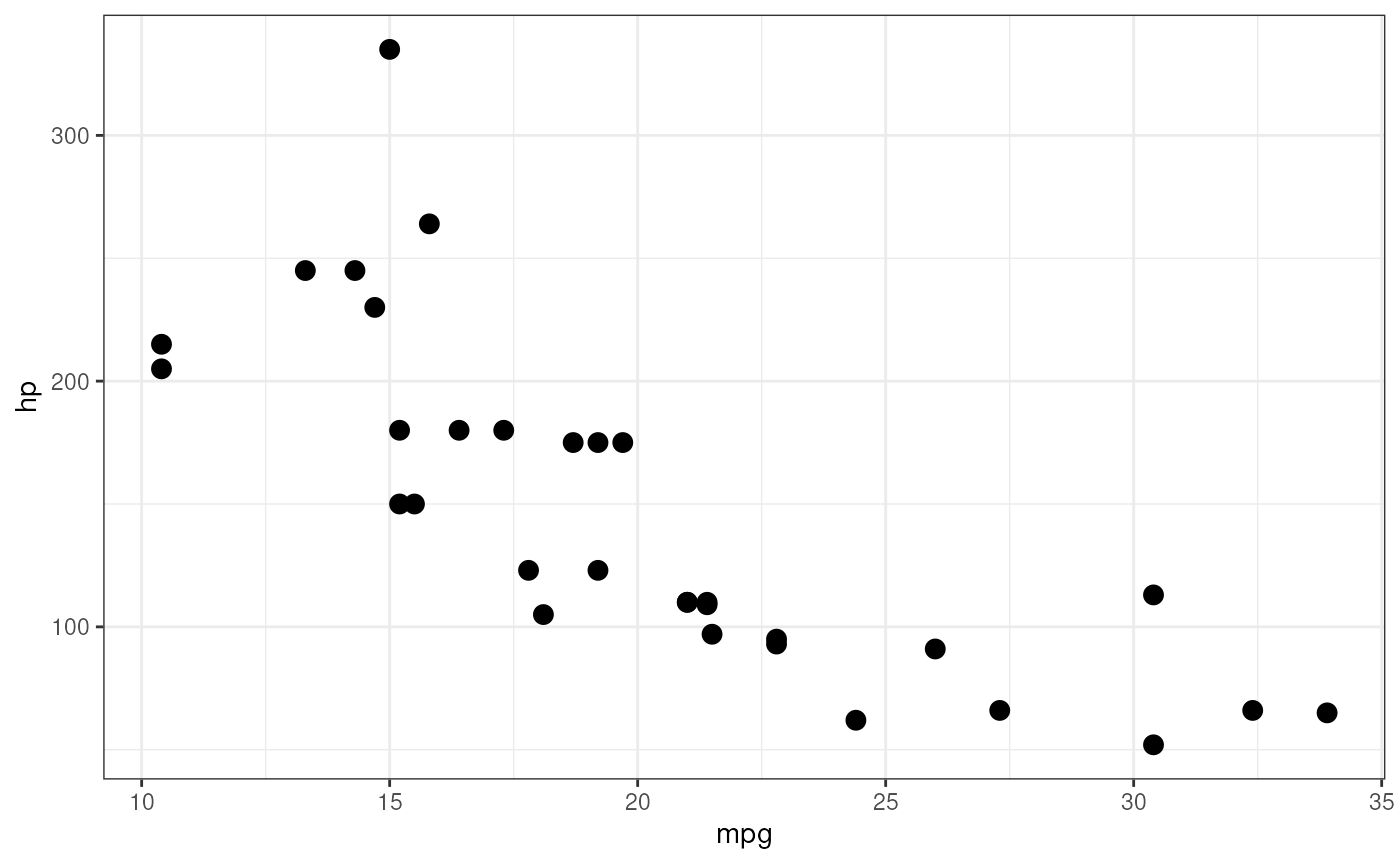
### A simple scatter plot
rosetta::scatterPlot(
mtcars$mpg, mtcars$hp
);
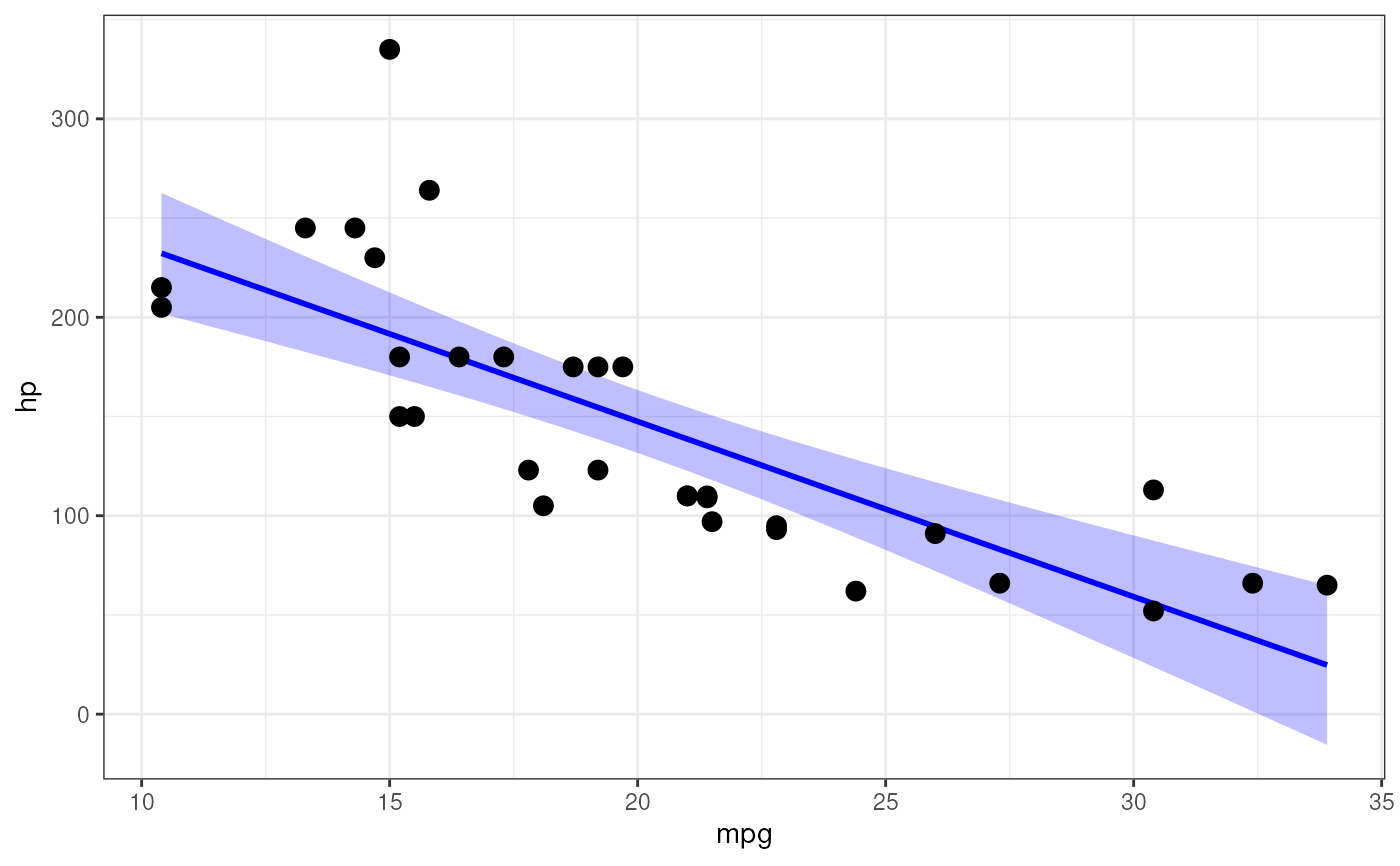
 ### The same scatter plot, now with a regression line
### and its confidence interval added.
rosetta::scatterPlot(
mtcars$mpg, mtcars$hp,
regrLine=TRUE,
regrCI=TRUE
);
#> `geom_smooth()` using formula = 'y ~ x'
### The same scatter plot, now with a regression line
### and its confidence interval added.
rosetta::scatterPlot(
mtcars$mpg, mtcars$hp,
regrLine=TRUE,
regrCI=TRUE
);
#> `geom_smooth()` using formula = 'y ~ x'